
Downtime costs money. But it does more than that—it kills user trust. Whether it’s a slow-loading page, a login failure, or a mobile crash, users don’t stick around to figure out why. They bounce.
That’s why businesses use application performance monitoring tools. These tools give teams visibility into app behavior, catch issues early, and help fix them before users notice anything’s wrong.
But speed alone doesn’t protect the user experience. If customers are connecting over throttled networks, public Wi-Fi, or remote locations, performance still suffers—even when your app is fast.
That’s where PureVPN’s white-label VPN comes in. While APM handles app speed, a VPN adds security, stability, and control at the network level. For SaaS providers, mobile app developers, or eSIM resellers, combining both means you protect every layer—from server to session.
This guide will break down how APM tools work, why they reduce churn, and how pairing them with VPNs creates a complete performance solution.
Let’s get into it.
What Are Application Performance Monitoring Tools?
Let’s keep it simple.
Application performance monitoring tools (or APM tools) track the performance of your app in real-time. They show you how fast your code runs, where errors occur, what users are doing, and when systems start acting weird.
They help you answer questions like:
- Why did the login API slow down last night?
- Why are users in Asia seeing a timeout screen?
- Which service is eating all the memory?
These insights matter. Not just to engineers, but to the business. Because slow apps mean frustrated users—and frustrated users don’t renew subscriptions.
How APM Tools Help Prevent Downtime?
Downtime doesn’t always start with a crash.
Sometimes, it begins with a slow query. Or a background process that’s failing silently. Or a third-party integration lagging behind.
Application performance monitoring tools catch these problems early.
Here’s how:
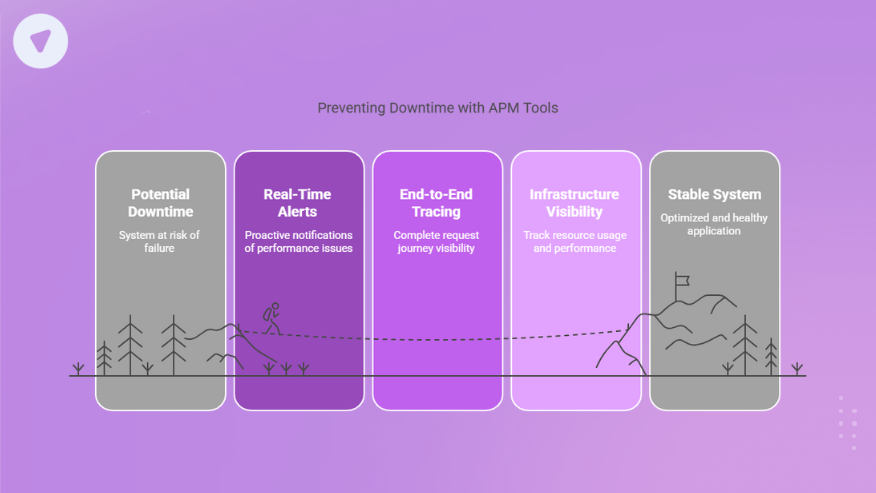
1. Real-Time Alerts
You set thresholds. When something goes wrong—too many errors, long response times—you get an alert. Before customers complain.
2. End-to-End Tracing
You see the full journey of a request. From the frontend to the database. One slow piece stands out immediately.
3. Infrastructure Visibility
Good APM tools also track CPU, memory, disk, and network stats. They don’t just tell you your app is slow—they tell you why.
When your backend starts to lag and you catch it within 30 seconds, that’s the difference between a fix and a flood of support tickets.
Downtime = Customer Churn (It’s That Simple)
Here’s what the data shows:
Users abandon apps that are slow, unreliable, or buggy. And most don’t come back.
Let’s say your mobile checkout crashes once a week. Or your search takes 5 seconds to load. That’s churn waiting to happen.
The cost? You lose revenue, sure. But you also damage your reputation. In B2B, that’s harder to recover from.
The right application monitoring tools reduce that churn. They give your team the power to:
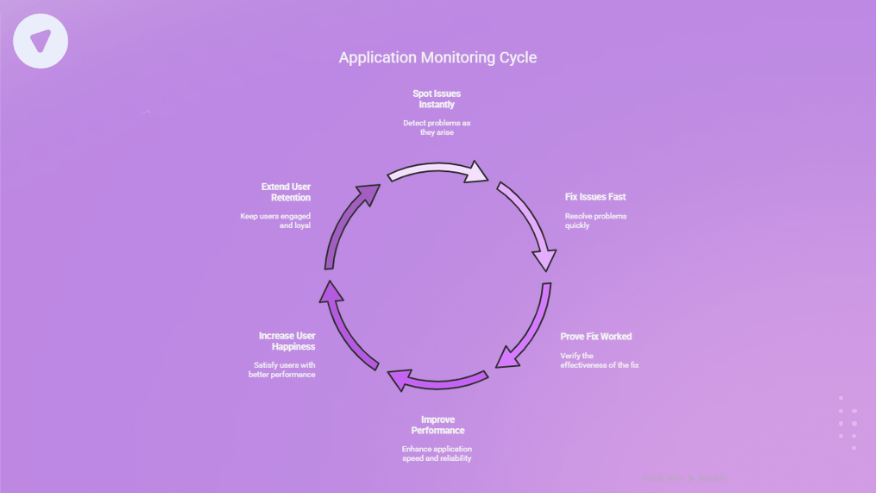
- Spot issues instantly
- Fix them fast
- Prove the fix worked
Better performance = happier users = longer retention.
What Should You Look for in an APM Tool?
Not all tools are created equal. Some are great for logs. Others for tracing. A few are good at dashboards but weak on alerts.
Here’s what really matters:
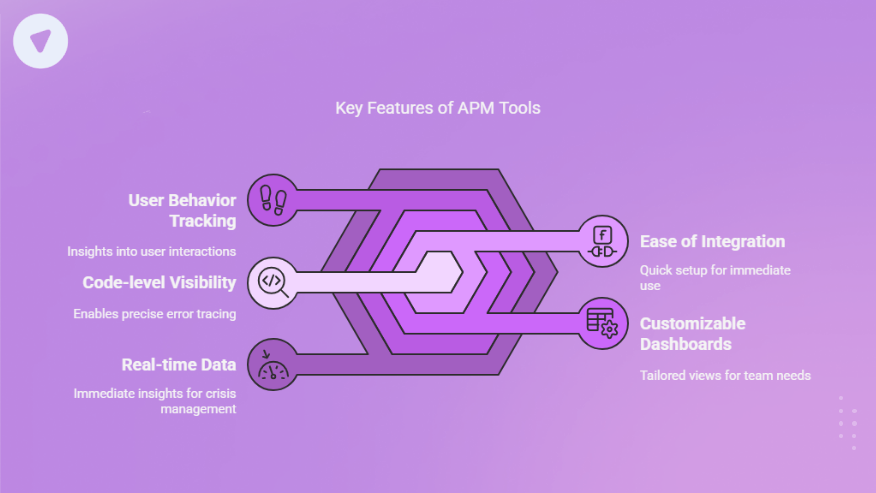
- Real-time data: Delayed metrics don’t help in crisis mode.
- User behavior tracking: Especially helpful for frontend or mobile apps.
- Customizable dashboards: Your team needs different views.
- Code-level visibility: If you can’t trace errors to a line of code, it’s not helpful.
- Ease of integration: You should be able to get started in minutes, not days.
If you’re dealing with distributed systems, microservices, or hybrid infrastructure, support for those environments is a must too.
What Tools Are Commonly Used for Monitoring Applications?
Commonly used application performance monitoring tools include New Relic, Datadog, AppDynamics, Dynatrace, and open-source options like Prometheus and Grafana.
Some are better for cloud-native stacks. Others shine in enterprise Java environments. A few focus on front-end UX.
Want to compare them? That’s where the application performance monitoring tools comparison matrix helps.
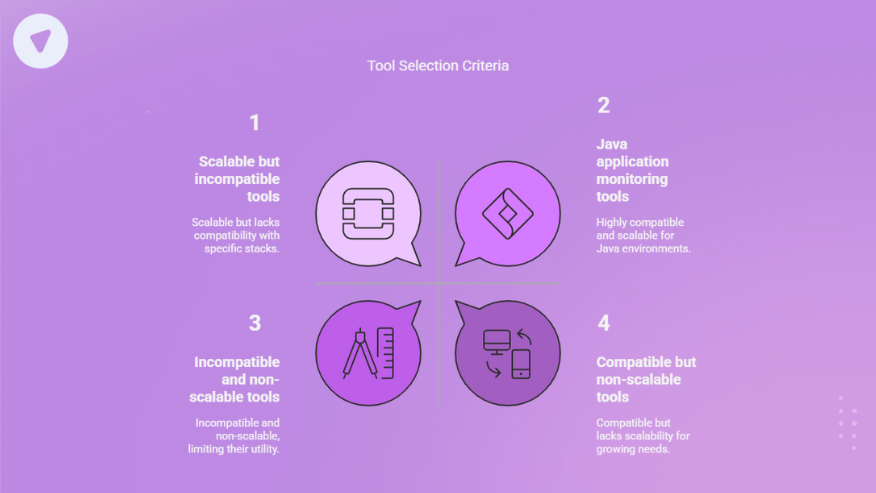
Pick tools based on:
- Stack compatibility (e.g., Java application monitoring tools)
- Price model (per host, per user, per data)
- Support and documentation
- Scalability
Comparison Tip: Don’t Choose Based on Logo
Just because a tool has a big brand doesn’t mean it fits your needs.
Here’s how to compare application performance monitoring tools:
| Tool | Best For | Stack Fit | Open Source? | Pricing Style |
| Datadog | DevOps + infra-heavy teams | All-in-one | No | Per host, per feature |
| New Relic | Full-stack observability | SaaS, browser-heavy | No | Freemium model |
| Prometheus | System-level metrics | Containerized apps | Yes | Free |
| AppDynamics | Enterprise apps | Java, .NET | No | License-based |
| Grafana | Visualization layer | Plug-in dashboards | Yes | Free/Cloud hosted |
Want flexibility? Pair open-source tools like Prometheus and Grafana with a white-label VPN solution from PureVPN to secure your infrastructure end-to-end. You get performance insights with full control—and encrypted access your users can trust.
Why Mobile Apps Need Monitoring Too?
Apps crash. Especially mobile ones.
You can’t see it unless you’re tracking real user sessions. That’s where mobile app monitoring tools come in.
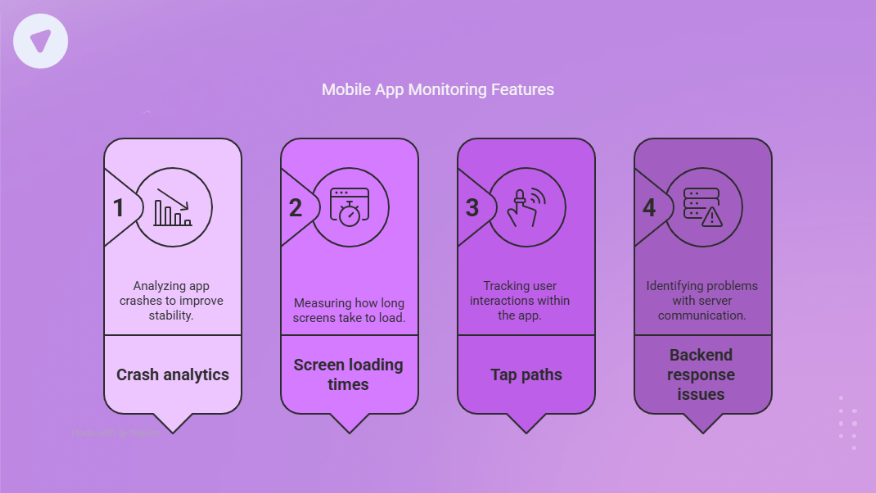
They show:
- Crash analytics
- Screen loading times
- Tap paths
- Backend response issues
For any app with real users on iOS or Android, mobile APM is essential.
And if your mobile app connects to a VPN, payment system, or custom backend, one delay can ruin the experience.
APM lets you fix that before the App Store reviews tank.
APM Isn’t Just About Error Logs
Sure, logs matter. But raw logs don’t show patterns. And they don’t help when response time is just…slow.
The best tools go deeper.
That’s what separates average web applications monitoring tools from great ones.
Example: You might not know your analytics service is delaying your login page. Or that your server’s CPU is spiking only when users hit a certain endpoint.
Web application monitoring tools highlight that in seconds.
And when you stack APM with performance monitoring tools for web applications, you start seeing the full picture—from the browser to the database.
APM in DevOps and CI/CD Pipelines
If you’re shipping code daily, weekly, or via CI/CD, you can’t afford blind spots.
Integrate APM directly into your deployment process.
- Catch regressions fast
- Monitor feature rollouts
- Compare performance before and after releases
It’s a no-brainer. Any list of the best monitoring tools will include APM integrations with tools like Jenkins, GitHub Actions, and CircleCI.
Don’t Just Use One Tool—Use the Right Stack
No tool does everything perfectly.
That’s why smart teams build monitoring stacks:
- One for APM (AppDynamics, New Relic)
- One for logs (ELK, Splunk)
- One for infra (Datadog, Prometheus)
- One for visualization (Grafana)
Use the right combo for your app’s size, budget, and complexity. You can always start small.
Need help figuring it out? Here’s a quick application monitoring tools list to consider based on team size:
| Team Size | Recommended Tools |
| Solo dev | Grafana + Prometheus (free) |
| Startup | Datadog, New Relic (freemium tiers) |
| Scale-up | AppDynamics, Sentry, custom dashboards |
| Enterprise | Dynatrace, custom-built stacks |
Slow Networks Kill Fast Apps: Add VPN to the Stack
Even if your app runs fast, users can still feel delays.
Especially if they’re connecting from insecure or throttled networks.
That’s why a white-label VPN is a smart add-on—especially if your product involves remote work, geo access, or data privacy.
VPNs reduce the risk of third-party interference, ISP throttling, or exposed sessions.
And if you’re reselling digital services or SaaS tools, bundling VPN with APM gives your customers performance and protection.
At PureVPN, our white label VPN platform lets resellers offer secure, private browsing under their own brand—without managing infrastructure.
It’s not just about uptime. It’s about trust.
Launch your branded VPN service here
Final Word: Your App’s Speed Is Your Business
If your app lags, your users don’t wait. They leave.
Application performance monitoring tools give you the edge to detect, diagnose, and fix issues before your users even notice.
Whether you’re managing a Java backend, mobile experience, or browser-heavy SaaS, monitoring isn’t optional anymore. It’s essential.
Don’t just measure uptime. Understand the full experience. React faster. And protect both your product and your users.
Start monitoring now—and stay ahead of the next slowdown.