Table of Contents
The significance of network monitoring cannot be overstated. Businesses and individuals rely on network connectivity for seamless operations, making the effective management of networks a cornerstone of modern digital infrastructure.
Contemporary networks and the importance of sustaining optimal performance require deploying sophisticated network management tools. As networks evolve, investing in advanced monitoring solutions is a strategic motive, ensuring businesses and individuals move with reliability and confidence.

Overview of Network Monitoring Tools
Network monitoring tools serve as network administrators’ vigilant eyes and ears, ensuring that digital landscapes operate smoothly and securely.
What are Network Monitoring Tools?
“Network monitoring tools are specialized software and hardware designed to watch over the intricate web of devices, connections, and data flows within a network. These tools keep a constant watch on the health, performance, and security of network components, capturing data that helps administrators keep networks functioning optimally.”

The Significance of Network Monitoring Tools:
The role of network monitoring tools goes beyond mere observation; they actively contribute to the well-being of networks in several ways:
Early detection of issues: They analyze real-time network data and alert administrators about anomalies, like sudden spikes in traffic or unusual patterns, allowing for swift investigation and resolution.
Optimizing performance: They monitor the flow by identifying congestion points. This information lets administrators allocate resources better, ensuring smooth data transfers.
Boosting security measures: They monitor for signs of unauthorized access attempts, flag suspicious activities, and offer insights into potential security breaches. In essence, they help keep cyber intruders at bay.

Source: Ramya Mohanakrishnan’s Network monitoring advantages
Planning for growth: Monitoring tools track data trends, helping predict when more resources might be needed. This foresight prevents unexpected slowdowns.
Meeting regulations: Many industries are bound by regulations that dictate how data should be handled. Monitoring tools generate reports that show compliance with these rules, keeping businesses on the right side of the law.
Intelligent resource management: They identify underutilized resources, like servers running at half-speed, and recommend ways to put them to better use, saving money and energy.
Satisfaction: Monitoring tools ensure applications play in harmony, providing quick response times and smooth employee and client interactions.
Key Features to Consider
While selecting your specific network monitoring tool, you must look for these essentials:
Comprehensive analytics
Thorough analysis and data summaries lie at the core of network monitoring. The chosen tool should evaluate network performance concerning essential indicators such as latency and velocity. Furthermore, it must generate location and device-specific data with accurate trend mapping. You can opt for and create your analytics inquiries depending on your setting.

Extensive compatibility
The tool must be adaptable to the most extensive array of networks and IT infrastructure components feasible. This encompasses software applications and hardware-oriented network appliances (for instance, a physical firewall or security apparatus). Additionally, you must be able to oversee network connectivity and current connectivity status for virtual machines offered by primary vendors like VMware.
Streamlined panels
Panels constitute the medium through which you will routinely observe network health and performance details. While data reports might be lengthy and intricate, panels should exhibit information for better comprehension. For this reason, you require intelligent data representations that portray the most immediate insights in an understandable, natural language layout.

Personalized notifications
The network supervision and monitoring tool should dispatch notifications whenever an uncommon network incident arises, a threshold is breached, or a device loses connection. You must personalize messages to obtain only the desired information. Furthermore, you should be able to configure custom notification channels such as email, SMS, and push notifications. This will assist in diminishing alert clutter and exclusively conveying valuable data.
Diverse interfaces
This function is gaining prominence within modern enterprises. IT experts may necessitate overseeing and inspecting networks while on the move, even apart from their workstations. With more organizations transitioning to remote and hybrid work for the long term, varied interfaces enable IT teams to exploit their smartphones and tablets to manage network operations from any site.
SolarWinds Network Performance Monitor
The SolarWinds Network Performance Monitor (NPM) stands out as a robust network monitoring solution, offering IT professionals a comprehensive suite of capabilities. With its easy-to-use interface and extensive monitoring capabilities, NPM empowers network administrators to manage and optimize their network infrastructure efficiently.
The tool’s intuitive design ensures quick navigation, enabling you to gain valuable insights into network performance without unnecessary complexity.

Key features of SolarWinds NPM include:
- Real-time monitoring: NPM provides real-time visibility into network performance metrics such as latency, packet loss, and bandwidth utilization, allowing administrators to detect and address network issues promptly.
- Alerting and notifications: The tool allows customisable alerts to be set up based on defined thresholds, ensuring administrators are promptly notified of any anomalies or breaches in network performance.
- Network mapping: SolarWinds NPM offers automated network discovery and mapping, clearly visualizing network topology and device relationships.
- Performance analysis: The platform enables in-depth analysis of historical performance data, allowing administrators to identify trends, patterns, and potential areas.
- Support: NPM is compatible with many network devices and vendors, facilitating seamless integration into heterogeneous network environments.
Was it ever compromised?

Source: Trojanized SolarWinds website for the deployment of RomCom attack.
PRTG Network Monitor

PRTG Network Monitor is a robust solution known for its extensive network monitoring capabilities, making it a preferred choice for IT administrators. It excels in providing real-time insights into an organization’s network health, performance, and availability. With PRTG, you can monitor a wide array of network devices, servers, applications, and services, proactively identifying potential issues before they impact the system’s efficiency.
One standout feature of PRTG is its customisable dashboards, which allow you to create tailored views that showcase critical metrics and information. These dashboards can suit specific roles or needs, ensuring that different teams or individuals can access the most relevant data for their responsibilities. Furthermore, PRTG’s convenient interface simplifies the setup process and monitoring configuration, minimizing the learning curve for you and ordinary employees.
Key features of PRTG Network Monitor include:
- Comprehensive monitoring of network devices, bandwidth usage, and performance metrics.
- Support various devices, including routers, switches, servers, and applications.
- Customisable and interactive dashboards for at-a-glance insights.
- Notification system with customisable alerts to keep administrators informed of issues.
- Historical data and reporting options for analyzing trends and performance over time.
Does it lack security sometimes?


Nagios XI

Nagios XI is a comprehensive network monitoring and alerting tool that provides a robust solution for managing complex IT infrastructures. Its network monitoring capabilities extend to various aspects, including server health, network devices, applications, and services. Nagios XI offers real-time monitoring, performance tracking, and customisable alerts, making it an essential tool for IT professionals.

In June 2023, Microsoft released a security advisory to address a critical vulnerability in its Windows Server Message Block (SMB) protocol. This vulnerability could allow an attacker to take control of a system by exploiting a flaw in how SMB handles specially crafted packets.

At the core of Nagios XI’s effectiveness lies its plugin architecture, which allows you to customize and extend its monitoring capabilities. This architecture develops and integrates custom plugins that cater to your specific monitoring needs. Whether monitoring proprietary applications, non-standard devices, or unique services, Nagios XI’s plugin architecture ensures flexibility and adaptability.
Key features include:
- Real-time monitoring of network devices, servers, and applications.
- Customisable alerts and notifications based on predefined thresholds.
- Comprehensive reporting and performance tracking.
- Scalability to accommodate both small and large IT environments.
- Integration with other tools and systems through APIs for enhanced functionality.
Some vulnerabilities in Nagios


Zabbix

Zabbix is a prominent open-source network monitoring solution that provides comprehensive insights into an organization’s IT infrastructure. It is renowned for its ability to monitor various network devices, servers, applications, and services, allowing IT professionals to gain real-time visibility into their network’s performance, availability, and health. Zabbix’s open-source nature fosters an active community that continually enhances its features and capabilities.
One of the standout features of Zabbix is its advanced alerting system. It allows your team to define intricate conditions and thresholds for triggering alerts, ensuring administrators are promptly informed of potential issues or anomalies. Moreover, Zabbix offers flexible notification options, enabling signals to be delivered through various channels, such as email, SMS, or custom scripts. Additionally, Zabbix provides rich visualization capabilities, including interactive dashboards and customisable graphs, empowering you to analyze performance metrics and trends effortlessly.
Key features of Zabbix’s open-source network monitoring solution include:
- Real-time monitoring of network devices, servers, and applications.
- Scalability to handle small to large-scale IT environments.
- Ability to create custom triggers and actions for alerting.
- Support for diverse notification methods and integrations.
- Interactive dashboards and graphing for data visualization and analysis.
Could the vulnerabilities be exploited?


Wireshark

Wireshark is a prominent packet analysis tool for understanding and diagnosing network-related problems. Its packet analysis capabilities allow us to capture, dissect, and analyze network traffic, providing a deep dive into the interactions between devices, applications, and protocols. Wireshark’s ability to capture packets in real-time or from stored capture files allows network administrators and analysts to identify performance bottlenecks, security vulnerabilities, and other network efficiency issues.

Wireshark’s role in troubleshooting network issues must be considered. By dissecting packets at a granular level, we can pinpoint the root causes of problems such as slow application performance, connectivity glitches, and abnormal behavior. The tool provides insightful details about protocol interactions, data flow, and communication patterns, which is particularly valuable for diagnosing complex issues in intricate network environments. Its user-friendly interface and powerful filtering capabilities further expedite the process of isolating problematic packets, helping IT professionals to address and resolve network challenges more effectively.
Key features of Wireshark’s packet analysis capabilities include:
- Real-time packet capture and analysis for immediate insights.
- Broad protocol support, allowing examination of diverse network traffic.
- Customisable filters to focus on specific packets of interest.
- Rich visualization of packet data through graphs and timelines.
- In-depth protocol analysis, highlighting details of packet headers and payloads.
Is Wireshark vulnerable?

ManageEngine OpManager

ManageEngine OpManager is a comprehensive network performance monitoring solution designed to provide IT teams with real-time insights into their network infrastructure’s health, availability, and performance. OpManager’s robust feature set allows administrators to proactively monitor network devices, servers, applications, and services, enabling them to detect and address potential issues before they impact our experience. With its simple interface and powerful capabilities, OpManager aids in maintaining optimal network performance and uptime.

One of the standout features of OpManager is its support for multi-vendor environments. In today’s heterogeneous IT landscape, where organizations utilize a variety of network devices and equipment from different manufacturers, OpManager excels in unifying monitoring efforts. It is compatible with various network devices and vendors, enabling administrators to manage and monitor their network infrastructure from a single, centralized platform. This multi-vendor support streamlines monitoring efforts and enhances visibility, making identifying and addressing performance bottlenecks or anomalies easier.
Key features include:
- Real-time monitoring of network devices, applications, and servers.
- Customisable dashboards and reports for tailored insights.
- Intelligent alerting system for proactive issue identification.
- Performance baselining and trend analysis for capacity planning.
- Multi-vendor support to manage diverse network equipment from a single interface.
Was it ever exploited?

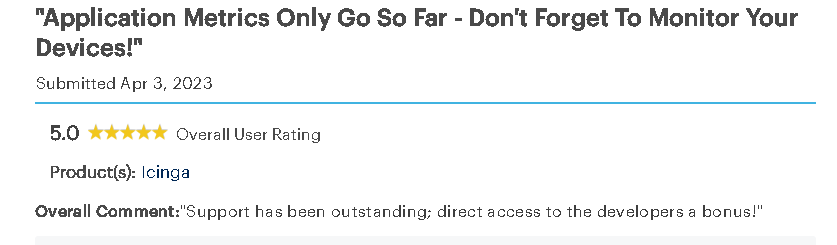
Icinga

Icinga is a powerful open-source monitoring platform that offers a comprehensive suite of monitoring features to ensure the health and availability of IT infrastructure components. Built upon Nagios, Icinga inherits its robust monitoring capabilities and extends them further with modern features and a flexible, open-source approach. With Icinga, we can monitor network devices, servers, applications, and services in real-time, enabling proactive identification of performance issues and potential bottlenecks.
One of the critical strengths of Icinga lies in its open-source nature. This means you can access the source code, allowing for customisation, extension, and community collaboration. Icinga’s flexibility is particularly evident in its configuration options. It supports various configuration methods, including text-based configuration files and web-based configuration interfaces, catering to the preferences of different people and making it easier to tailor the monitoring setup to an organization’s specific needs. This flexibility extends to defining custom thresholds, notification rules, and escalation policies, ensuring monitoring aligns with an organization’s unique requirements.
Key features include:
- Real-time monitoring of network devices, servers, and applications.
- Customisable dashboards and reporting for data visualization.
- Support for distributed monitoring for larger environments.
- Extensible through plugins and extensions for additional functionality.
- Integration with various alerting mechanisms, including email and SMS.
Are tools all secure?

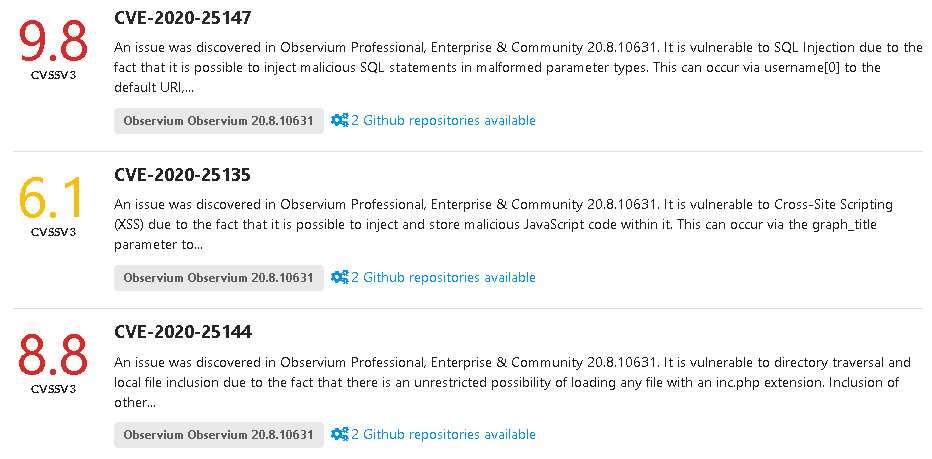
Observium

Observium is a network monitoring and management platform that strongly emphasizes automation and visualization. One of its standout features is its automatic network discovery and mapping capabilities. Observium excels at identifying and adding devices to its monitoring system without manual configuration, making it highly efficient for maintaining an up-to-date inventory of network devices. This automatic discovery process extends to creating detailed network maps visually representing device relationships and connections. This feature simplifies network troubleshooting by providing a clear understanding of device interdependencies.

Observium’s focus on network visualization is a crucial aspect of its functionality. The platform offers comprehensive network maps that display device status, performance metrics, and connections. These visual representations aid administrators in quickly assessing network health and identifying potential issues. Additionally, Observium provides dynamic graphs that show historical data and performance trends, enabling us to analyze changes over time and make informed decisions to optimize network performance.
Key features of Observium are:
- Automatic device discovery and addition to the monitoring system.
- Detailed network mapping to visualize device relationships and connections.
- Dynamic graphs display historical performance data for trend analysis.
- Real-time monitoring of network devices, servers, and applications.
- Support for SNMP and other protocols for collecting data from network devices.
Was it ever vulnerable?
Cisco Prime Infrastructure
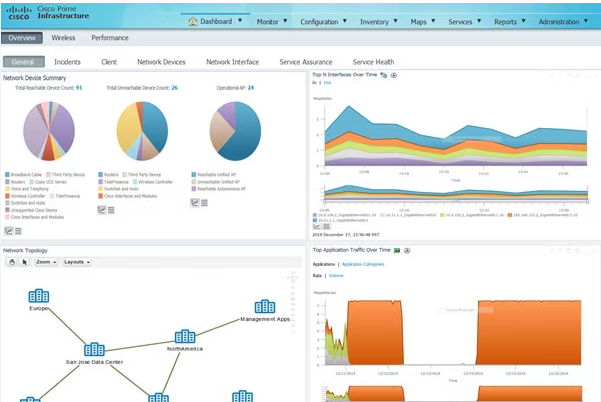
Cisco Prime Infrastructure is a comprehensive network management solution designed to streamline the management and monitoring of Cisco devices and infrastructure. It offers an array of powerful capabilities that cater to the needs of IT administrators in efficiently managing their Cisco-based networks. One of its standout features is its deep integration with Cisco devices, which enables administrators to gain granular visibility into the performance, health, and configuration of Cisco routers, switches, access points, and other network components.

The platform provides end-to-end network management, encompassing tasks such as device provisioning, configuration management, monitoring, troubleshooting, and reporting. With Cisco Prime Infrastructure, we can efficiently monitor the performance of Cisco devices in real time, allowing quick identification of anomalies and potential issues. Its integration with Cisco’s One Identity Services Engine (ISE) further enhances security management by providing insights into access and network policies.
Key features of Cisco Prime Infrastructure’s network management capabilities include:
- Deep integration with Cisco devices, providing comprehensive visibility and control.
- Configuration management and compliance monitoring for maintaining consistent device configurations.
- Real-time monitoring of device performance and health, aiding in proactive issue identification.
- Automated provisioning and software updates to ensure devices are up-to-date.
- Role-based access control for secure and controlled network management.
Every system is vulnerable, right?

Pandora FMS

Pandora FMS is a comprehensive monitoring solution that adopts a hybrid monitoring approach, catering to both on-premises and cloud-based environments. This approach allows organizations to monitor various infrastructure components, including servers, networks, applications, and services, regardless of location. Pandora FMS’s hybrid monitoring capability ensures administrators have a unified view of their entire infrastructure, providing insights into performance, availability, and potential issues across diverse environments.
💡In July 2023, Cisco released a security advisory to address a critical vulnerability in its Webex Meetings software. This vulnerability could allow an attacker to take control of a system by exploiting a flaw in how Webex Meetings handles specially crafted messages.
The platform’s scalability and customizability are notable features that make it well-suited for businesses of varying sizes and needs. Pandora FMS can handle both small-scale and large-scale deployments, adapting to an organization’s growth and changing requirements. It offers flexible data collection mechanisms, including agent-based and agentless options, enabling you to tailor monitoring strategies to their specific environment. Additionally, Pandora FMS supports custom modules and plugins, allowing us to extend its monitoring capabilities and adapt the solution to unique use cases.
Key features of Pandora FMS’s hybrid monitoring approach are:
- Hybrid monitoring for on-premises and cloud-based environments.
- Real-time performance monitoring of servers, networks, and applications.
- Scalability to accommodate both small and large IT infrastructures.
- Customisable monitoring through agent-based and agentless data collection.
- Support for custom modules and plugins for additional monitoring capabilities.
Unexploited vulnerabilities
Datadog

Datadog is a cloud-based network monitoring platform that provides organizations with the tools to monitor, analyze, and optimize their IT infrastructure across on-premises, cloud, and hybrid environments. One of its key strengths is its cloud-centric approach to monitoring, which allows you to gain insights into the performance and availability of network resources, applications, and services from anywhere. Datadog’s cloud-based architecture ensures real-time visibility into the health and performance of complex IT ecosystems, making it well-suited for modern businesses with dynamic and distributed infrastructures.

A standout feature of Datadog is its robust integration with a wide range of cloud services and platforms. It supports seamless integration with popular cloud providers such as AWS, Azure, and Google Cloud, allowing you to monitor and analyze their cloud-based resources alongside on-premises assets. This integration extends to various services, such as databases, containers, and serverless functions, providing a comprehensive view of the entire stack. Additionally, Datadog’s customisable dashboards and automated alerts enable us to set up monitoring tailored to their specific needs, ensuring prompt identification of issues and optimal resource utilization.
Key features of Datadog’s cloud-based network monitoring include:
- Real-time tracking of cloud, on-premises, and hybrid environments.
- Deep integration with leading cloud providers and services.
- Customizable dashboards and visualizations for tailored insights.
- Automated alerting for proactive issue identification and resolution.
- Support for monitoring a wide range of technologies, including containers and microservices.

LogicMonitor

LogicMonitor is a leading automated network monitoring solution designed to provide organizations with a comprehensive view of their IT infrastructure’s performance, health, and availability. The platform’s automated approach streamlines the monitoring process by automatically discovering devices, collecting data, and generating insights, reducing the need for manual configuration and intervention. LogicMonitor’s emphasis on automation enables IT teams to gain real-time visibility into networks, servers, applications, and more, helping them proactively identify and address potential issues.

Its focus on IT infrastructure monitoring is at the core of LogicMonitor’s capabilities. The platform offers a wide range of pre-configured monitoring templates for various technologies and devices, making it easy to start monitoring quickly. Whether it’s network devices, cloud resources, databases, or applications, LogicMonitor provides out-of-the-box monitoring capabilities. This focus extends to providing granular performance data and insights, enabling IT professionals to make informed decisions for optimizing their infrastructure.
Key features of LogicMonitor’s automated network monitoring include:
- Automatic discovery of devices and infrastructure components.
- Pre-configured monitoring templates for a variety of technologies.
- Real-time insights into performance, health, and availability.
- Customizable dashboards and reporting for tailored visibility.
- Integration with popular cloud providers and services for comprehensive monitoring.
Addressed vulnerabilities

Zenoss
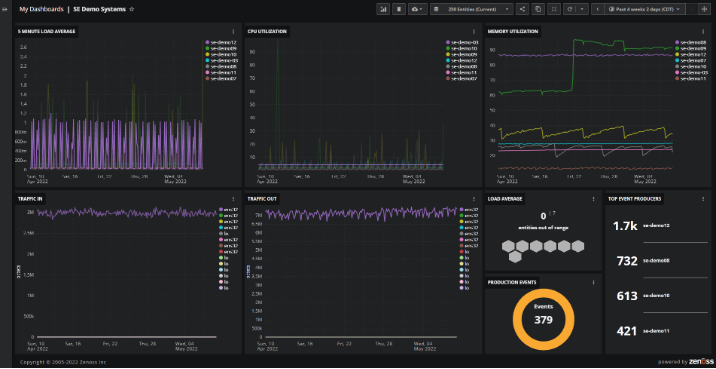
Zenoss provides a comprehensive, unified monitoring platform that offers organizations a robust solution to oversee their IT infrastructure and applications. This platform combines real-time monitoring, event management, and reporting to ensure optimal performance and availability of critical systems. Zenoss’s unified monitoring approach allows businesses to gain deep insights into their entire IT ecosystem, which includes physical, virtual, cloud, and hybrid environments. By integrating diverse data sources, Zenoss offers a holistic view of the infrastructure, enabling timely identification and resolution of potential issues.

Zenoss’s event management capabilities play a vital role in maintaining system health. Based on predefined thresholds or machine learning algorithms, the platform can automatically detect and prioritize events, such as performance anomalies or outages. This helps IT teams focus on critical events and minimize downtime. Zenoss’s reporting features also empower employees to generate customisable reports and dashboards that visualize performance data, resource utilization, and trends. These reports aid in decision-making, capacity planning, and overall infrastructure optimisation.
Key features of Zenoss’s unified monitoring platform include:
- Real-time monitoring of diverse environments, including cloud and hybrid setups.
- Automatic event detection and prioritization for efficient issue resolution.
- Customisable reporting and dashboard creation for data visualization.
- Capacity planning tools to anticipate resource requirements.
- Integration with various data sources and third-party tools for seamless operation.

Paessler Network Monitor

Paessler Network Monitor offers a comprehensive network monitoring solution designed to help businesses ensure their IT infrastructure’s stability, performance, and security. One of its standout features is its robust remote monitoring capabilities, which allow organizations to easily oversee distributed networks, remote offices, and geographically dispersed assets. Paessler’s solution provides real-time insights into network health, bandwidth utilization, device statuses, and more, enabling proactive identification and resolution of issues. The platform’s straightforward interface and customizable alerts streamline the monitoring process, making it a valuable tool for IT teams seeking to maintain a seamless network environment.
Paessler Network Monitor’s remote monitoring features encompass a range of capabilities, including remote sensor deployment, remote access monitoring, and support for monitoring devices in different locations. With customisable sensor types, administrators can monitor various aspects of remote assets, such as hardware health, application performance, and environmental conditions. The solution also offers secure remote access, allowing IT teams to troubleshoot and manage remote devices without compromising security protocols. Overall, Paessler’s network monitoring solution empowers businesses to maintain the health and functionality of their network infrastructure, regardless of physical distance.
Key features of Paessler Network Monitor’s remote monitoring capabilities include:
- Remote sensor deployment for monitoring devices across dispersed locations.
- Customizable sensor types for monitoring diverse aspects of remote assets.
- Secure remote access to troubleshoot and manage remote devices.
- Real-time alerts and notifications for prompt issue resolution.
- User-friendly interface and customizable dashboards for easy monitoring.

NetCrunch

NetCrunch offers a robust real-time network monitoring and visualization solution that provides IT professionals with a comprehensive view of their network infrastructure. At the core of NetCrunch’s capabilities is its real-time monitoring functionality, which enables administrators to track the health and performance of various network components in real-time. This ensures prompt detection of anomalies, potential bottlenecks, and security breaches, allowing for quick response and issue resolution. The platform’s dynamic and interactive visualization tools aid in understanding complex network topologies, helping IT teams make informed decisions to optimize network efficiency and stability.

One of the standout features of NetCrunch is its automatic network mapping functionality. This feature creates detailed and up-to-date network maps that accurately represent the relationships between devices, connections, and dependencies. This automatic mapping reduces the manual effort required to maintain an accurate network representation, which can be especially beneficial in large and complex environments. NetCrunch’s event correlation and alerting capabilities help administrators prioritize and respond to critical issues efficiently, enhancing overall network reliability.
Key features of NetCrunch’s real-time monitoring and visualization include:
- Real-time monitoring for immediate issue detection and resolution.
- Interactive network visualization to comprehend complex topologies.
- Automatic network mapping for accurate and up-to-date network representations.
- Event correlation and alerting for efficient incident response.
- Scalability to accommodate networks of varying sizes and complexities.

OpenNMS

OpenNMS stands out as a robust open-source network management platform that offers a comprehensive suite of tools to monitor and manage complex IT environments. Its noteworthy attribute is its impressive scalability, making it well-suited for networks of various sizes and levels of complexity. This scalability allows organizations to grow and adapt their network infrastructure without compromising OpenNMS’s monitoring and management capabilities.
🔎 In February 2023, Google’s TAG discovered a vulnerability in the Chrome web browser that attackers could have exploited to steal cookies and other sensitive information. The vulnerability was identified by TAG’s network monitoring tools, which allowed them to see that attackers were trying to exploit it. Google notified the Chrome team of the vulnerability, and the Chrome team released a patch to fix it.

One of the core focuses of OpenNMS is performance monitoring. It provides a wide range of performance-related metrics and insights, allowing IT teams to track and analyze the health and efficiency of their network components. OpenNMS’s monitoring capabilities extend beyond performance to include availability and fault monitoring, ensuring that potential issues are promptly identified and addressed. Its flexibility and extensibility further enable us to tailor the platform to their specific monitoring needs, integrating with other tools and systems as required.
Key features of OpenNMS’s open-source network management platform include:
- Scalability to accommodate networks of varying sizes and complexities.
- Comprehensive performance monitoring to track network efficiency and health.
- Availability and fault monitoring for timely issue identification.
- Extensible architecture for customisation and integration with other tools.
- Real-time and historical data analysis for insights into network trends.

Dynatrace

Dynatrace stands at the forefront of AI-powered network monitoring solutions, providing organizations with an innovative approach to ensuring optimal application performance. This platform utilizes advanced artificial intelligence and machine learning algorithms to offer deep insights into application behavior and network health. One of its primary strengths lies in its ability to detect and diagnose issues in real time, enabling IT teams to address performance bottlenecks and disruptions swiftly. By constantly monitoring applications across various environments, including cloud, hybrid, and on-premises setups, Dynatrace empowers businesses to enhance their experiences and streamline their applications for peak performance.
Dynatrace places a strong emphasis on application performance monitoring. Its all-encompassing approach provides a comprehensive view of the application stack, from your experience to the underlying infrastructure. This holistic insight enables IT teams to pinpoint the root causes of performance problems, leading to quicker issue resolution. Additionally, Dynatrace offers continuous improvement and optimisation of application performance, leveraging AI insights to guide organizations toward refining their applications’ efficiency and responsiveness.
Key features of Dynatrace’s AI-powered network monitoring include:
- AI-driven automatic issue detection and diagnosis for efficient problem resolution.
- Real-time monitoring of applications across diverse environments.
- Comprehensive visibility into the application stack.
- Root cause analysis to swiftly identify the source of performance issues.
- Continuous improvement and optimisation of application performance based on AI insights.

WhatsUp Gold

WhatsUp Gold offers a comprehensive network monitoring and management solution that empowers IT professionals to oversee their network infrastructure’s health, performance, and availability. At the core of its capabilities is monitoring network devices, servers, applications, and services in real-time. WhatsUp Gold’s proactive monitoring approach enables IT teams to identify potential issues and bottlenecks before they impact anyone’s experience. The platform provides a centralized dashboard for monitoring and reporting, streamlining the management process and enhancing the overall network performance.
One of the standout features of WhatsUp Gold is its network visualization capabilities. The platform offers dynamic and interactive network maps that visually represent the entire network topology. This visualization aids IT teams in understanding the relationships between devices, connections, and dependencies, facilitating efficient troubleshooting and decision-making.
WhatsUp Gold’s customisable alerts and notifications ensure that administrators are promptly informed of critical events, allowing for swift response and issue resolution. Furthermore, the solution supports network discovery, automation, and reporting, making it a comprehensive tool for maintaining a reliable and optimized network environment.
Key features of WhatsUp Gold’s network monitoring and management include:
- Real-time monitoring of network devices, servers, applications, and services.
- A centralized dashboard for monitoring and reporting network health and performance.
- Dynamic network visualization with interactive maps for easy troubleshooting.
- Customisable alerts and notifications for prompt incident response.
- Network discovery, automation, and reporting to streamline network management tasks.

LanSweeper

LanSweeper offers a comprehensive network inventory and monitoring solution that provides organizations with the tools to manage their IT assets and monitor network components efficiently. At its core, LanSweeper allows IT professionals to gain insights into their network’s hardware and software resources. This includes devices, servers, applications, and more, providing a holistic view of the organization’s IT environment. By continuously scanning the network, LanSweeper helps businesses stay up-to-date with asset information, ensuring accurate inventory management and compliance tracking.
One of LanSweeper’s strengths lies in its asset management features. The platform enables organizations to track hardware and software details, such as warranties, licenses, and usage metrics. This information assists IT teams in making informed decisions about software licensing, maintenance schedules, and hardware upgrades.
Additionally, LanSweeper offers customisable reports and dashboards that provide visual representations of asset data, helping organizations gain insights into usage trends and resource allocation. With its convenient interface and automation capabilities, LanSweeper simplifies maintaining an organized and optimized IT infrastructure.

Key features of LanSweeper are:
- Comprehensive network inventory for tracking hardware and software assets.
- Continuous scanning to ensure up-to-date and accurate asset information.
- Asset management features for monitoring warranties, licenses, and usage metrics.
- Customisable reports and dashboards for visualizing asset data.
- Easy-to-use interface and automation capabilities for streamlined asset management.
ThousandEyes

ThousandEyes offers a comprehensive network monitoring solution tailored for cloud environments, providing organizations with a powerful tool to monitor the performance, availability, and security of their networks across the globe. The standout feature of ThousandEyes lies in its global network visibility capabilities. This platform employs a distributed network of monitoring points strategically positioned worldwide to offer real-time insights into network performance and your experience from various geographic locations. This global perspective empowers IT teams to identify and troubleshoot issues that could affect you in different regions, ensuring consistent and reliable network performance regardless of location.

ThousandEyes’s cloud-focused monitoring includes tracking network paths and performance metrics for applications hosted in public cloud platforms. It provides insights into latency, packet loss, and jitter for cloud-based services, enabling organizations to optimize their cloud infrastructure for optimal experience.
The platform’s advanced monitoring extends to hybrid environments, offering visibility into both on-premises and cloud components. Additionally, ThousandEyes offers customisable alerts and real-time dashboards that display key performance indicators, allowing IT teams to stay informed and take proactive measures to maintain network health and satisfaction.
Key features of ThousandEyes’ network monitoring for cloud environments include:
- Global network visibility through a distributed monitoring infrastructure.
- Tracking of network paths and performance metrics for cloud applications.
- Insights into latency, packet loss, and jitter for cloud-based services.
- Hybrid environment monitoring covering both on-premises and cloud components.
- Customisable alerts and real-time dashboards for proactive network management.

NetFlow Analyzer

NetFlow Analyzer is a powerful network traffic analysis solution that provides organizations with in-depth insights into their network’s bandwidth usage and traffic patterns. At the core of its capabilities is its ability to monitor and analyze network traffic using NetFlow, IPFIX, and other flow protocols.
IT teams can understand how network resources are utilized, identify bottlenecks, and optimize bandwidth allocation. NetFlow Analyzer empowers organizations to make informed decisions about network optimization and resource allocation by providing detailed insights into application traffic, behavior, and communication trends.
A key feature of NetFlow Analyzer is its bandwidth usage analysis. The platform offers real-time and historical data on bandwidth consumption, helping IT teams identify which applications, protocols, and employees are consuming the most resources. This information aids in optimizing network performance, ensuring fair resource allocation, and identifying potential security threats.
Additionally, NetFlow Analyzer provides customizable reports and dashboards that visualize traffic trends, enabling administrators to monitor network health, detect anomalies, and plan for capacity upgrades.
Key feature:
- Monitoring and analysis of network traffic using NetFlow and other flow protocols.
- Insights into application traffic, behavior, and communication patterns.
- Bandwidth usage analysis for optimizing network performance and resource allocation.
- Real-time and historical data on bandwidth consumption and network trends.
- Customizable reports and dashboards for visualizing traffic patterns and network health.

AppNeta

AppNeta offers comprehensive network monitoring solutions tailored to the needs of remote and distributed teams. With the rise of remote work, maintaining a stable and high-performing network is crucial for businesses to ensure uninterrupted productivity. AppNeta’s network monitoring solutions address these challenges by providing real-time visibility into network performance and employee experience, regardless of physical location.

In April 2023, Cloudflare’s ZDI discovered a vulnerability in the Apple iOS operating system that attackers could have exploited to take control of a device. The vulnerability was identified by ZDI’s use of network monitoring tools, which allowed them to see that attackers were trying to exploit it. Apple released a patch to fix the vulnerability.
One of AppNeta’s key strengths lies in its end-user experience monitoring, which allows businesses to gain insights into how their applications are performing from the perspective of end users. This helps in identifying and resolving issues proactively, thus enhancing overall satisfaction.
Key features of AppNeta’s network monitoring for remote and distributed teams include:
- AppNeta provides complete visibility into the entire network path, from end users to the applications and servers, enabling teams to pinpoint performance bottlenecks.
- The platform tracks application performance metrics, allowing teams to analyze response times, transaction rates, and other vital application-specific data.
- AppNeta’s monitoring tools access network paths in real-time, identifying network congestion, latency, and other factors impacting your experience.
- With synthetic monitoring, teams can simulate their interactions to monitor application performance and responsiveness, helping to identify potential issues before you or your team are affected.
- AppNeta extends its monitoring capabilities to cloud-based applications and services, ensuring that remote teams can access their tools without a drop in performance.


Centreon

Centreon offers a robust hybrid IT monitoring platform to provide organizations with comprehensive insights into their IT infrastructure’s health and performance. With the increasing complexity of IT environments, Centreon’s solution enables businesses to monitor both traditional on-premises systems and cloud-based resources from a single unified platform.

This hybrid approach allows IT teams to proactively identify issues, ensure optimal performance, and maintain the availability of critical services. A notable feature of Centreon is its seamless integration with IT Service Management (ITSM) tools, streamlining incident management and enabling efficient collaboration between monitoring and support teams.
Key features of Centreon’s hybrid IT monitoring platform include:
- Centreon supports the monitoring of cloud resources across various providers, ensuring organizations have real-time visibility into the performance of their cloud-based applications and services.
- The platform offers comprehensive network and infrastructure monitoring capabilities, tracking the health and performance of servers, routers, switches, and other network components.
- Centreon’s APM capabilities allow organizations to monitor the performance of critical applications, ensuring optimal response times and better experiences.
- You can create personalized dashboards with relevant performance metrics and visualizations, enabling quick insights into the health of their IT environment.
- Centreon seamlessly integrates with ITSM tools, automating incident creation and resolution workflows, facilitating collaboration between monitoring and support teams, and ensuring timely issue resolution.

Axence nVision

Axence nVision offers a comprehensive network monitoring and management solution that caters to the needs of businesses seeking to ensure the stability and security of their IT infrastructure. With a wide range of features, nVision enables IT teams to monitor network performance, manage devices, and implement security measures from a single platform.

The solution’s emphasis on real-time monitoring and proactive management allows organizations to detect and address potential issues before they impact operations. One of the standout aspects of Axence nVision is its holistic approach, offering features that cover everything from network visualization to security enhancements.
Key features of Axence nVision’s network monitoring and management solution include:
- nVision provides a clear visual representation of the network topology, helping IT teams to understand the layout of devices, connections, and dependencies.
- The platform enables real-time monitoring of network devices, including servers, routers, switches, and endpoints. It allows for remote management and configuration of these devices to ensure optimal performance.
- Axence nVision allows organizations to track bandwidth usage and traffic patterns, aiding in the identification of potential bottlenecks and resource-intensive applications.
- The solution includes security features such as intrusion detection, firewall management, and compliance monitoring to safeguard the network against threats and maintain regulatory compliance.
- nVision offers integrated help desk and ticketing capabilities, streamlining incident management and support workflows for efficient issue resolution.

Catchpoint Network Experience

Catchpoint offers a comprehensive Network Experience Monitoring solution that empowers businesses to gain valuable insights into their network performance, ensuring seamless digital experiences for your team. This platform provides a holistic overview of performance indicators, including real-time data on website and application responsiveness and network infrastructure health. Catchpoint’s Performance Indicators offer deep visibility into page load times, transaction completion rates, and global network latency metrics. This allows businesses to identify bottlenecks proactively, troubleshoot issues, and optimize their digital services for optimal experiences.


The Catchpoint platform also includes BGP Assessment, a critical feature that assesses Border Gateway Protocol (BGP) routes and their impact on network performance. This tool detects routing changes, measures their effects on network traffic, and helps organizations mitigate the risks of poor routing decisions that could lead to performance degradation. Moreover,
Catchpoint’s LAN Monitoring Services enable businesses to monitor their local area networks for network congestion, bandwidth utilization, and overall network health. By leveraging these services, organizations can ensure efficient data transmission within their internal network infrastructure, enhancing employee productivity and application performance.
Key features of Catchpoint’s Network Experience Monitoring include:
- Real-time metrics on webpage and application performance, allowing proactive optimization.
- Evaluating BGP routing to minimize potential network disruptions caused by routing changes.
- Monitoring internal networks for congestion and health, ensuring seamless data flow.
- Measuring network latency across multiple geographic locations for accurate performance assessment.
- Tracking end-to-end interactions within applications, pinpointing bottlenecks and optimizing workflows.
Which Underlying Protocol Enables Network Monitoring Tools to Work?
Network monitoring tools rely on various underlying protocols to function effectively. One core protocol enabling these tools to operate is the Simple Network Management Protocol (SNMP). SNMP monitors and manages network devices, allowing the tools to gather information about device status, performance metrics, and other relevant data. It operates on an agent-manager model, where network devices act as SNMP agents that provide information, and the monitoring tools function as SNMP managers that collect and analyze the data.

In addition to SNMP, network monitoring tools often utilize protocols like ICMP (Internet Control Message Protocol) for basic connectivity testing, ICMP ping for latency measurement, and flow protocols like NetFlow or sFlow for analyzing traffic patterns and identifying sources of congestion or bottlenecks.

These underlying protocols collectively enable network monitoring tools to continuously assess the health, performance, and security of network devices and traffic, providing valuable insights to network administrators and IT teams for effective management and troubleshooting.
What Are the Minimum Functions Supported by all Network Monitoring Tools?
All network monitoring tools typically support a core set of minimum functions to monitor and manage network infrastructure effectively. These functions include:
- Device Discovery: Identifying and cataloging all devices within the network to create an inventory for monitoring.
- Device Availability Monitoring: Checking if network devices are online and responsive.
- Performance Monitoring: Tracking key performance metrics like bandwidth usage, CPU utilization, memory usage, and response times.
- Alerting and Notifications: Sending real-time alerts and notifications when predefined thresholds are exceeded, or critical events occur.
- Reporting: Generating regular reports on device performance, network health, and historical data trends.
- Bandwidth Monitoring: Measuring and analyzing data traffic to identify patterns, congestion, and potential bottlenecks.
- Fault Detection: Detecting faults and anomalies that could indicate network issues or outages.
- Network Mapping: Visualizing the network’s topology, including device connections and relationships.
- Trend Analysis: Identifying long-term trends and patterns in network behavior and performance.
- Remote Monitoring: Allowing administrators to monitor and manage network devices remotely.
Expert opinion about the importance of network monitoring tools
The importance of network monitoring tools should be addressed. Even the top security analysts believe in its importance in business. Brandy Gordon, security engineer and analyst, believes that “there are many monitoring tools that can detect traffic signatures and abnormal behavior. The key is configuring network solutions where detection is followed by automated prevention. This prevention may include request limits, restrictions and blocking. For many organizations they have found this type of solution in a SIEM/SOAR combination, followed by IPS activities.”
Martín Martín, ethical hacker, pentester and bug bounty hunter, says, “regarding web/mobile applications, it is crucial to identify which of your applications hold the highest value based on your business criteria. Once identified, conduct manual pentests for the critical ones.”
“Some of the most critical bugs/findings within applications originate from the complex and intricate matrix of application logic. These types of bugs cannot be identified using automated tools. You’ll require a pentester with sufficient experience to manually analyze the application, comprehend its functioning and understand how it can be exploited.”
On the other hand, an IT industry analyst, Shamus McGillicuddy believes that “engineers often tell me it takes weeks, if not months, for a network monitoring solution to deliver value to an organization. Every tool requires some customization to fit a given network, but the sheer volume of custom work required to deliver value is too high.”
He added, “it’s one thing to customize your tool to fit the idiosyncrasies of your network. It’s another to customize the tool so that it can provide you with insights. Our new network observability research has found that most IT organizations must customize their tools in order to get meaningful insights from them. The volume of custom work required is undermining the tools’ value by driving up costs and negatively impacting adoption.”
Network management is your secure strategic policy
Quantum cryptography introduces unprecedented risks that could disrupt existing security protocols. Likewise, sophisticated cyber attacks exploit vulnerabilities that are constantly emerging. Network monitoring tools appear as critical defenses for today and tomorrow. They provide real-time visibility into network activities as early warning systems, enabling prompt responses to potential threats and vulnerabilities. These tools empower organizations to identify anomalous behaviors, sudden traffic spikes, or unusual access patterns that could signify an attack or a breach attempt. This proactive approach ensures security teams stay one step ahead of these emerging risks.
Many companies have recognised the practical benefits of network monitoring tools in managing their security posture. Privacy breaches have taken a new turn; MOVEit is the evidence, which targeted over 140 organizations and compromised the personal data of more than 15.5 million individuals worldwide.
The blog has extensively covered the highlighting features of top network monitoring tools. It is now your discretion to choose the best one for yourself. Also, trying a free trial before you go for a premium subscription is always a better idea. Remember! Security is all about effective management. 🤝
Marrium Akhtar
August 21, 2023
9 months ago